> ## Documentation Index
> Fetch the complete documentation index at: https://docs.camo.ag/llms.txt
> Use this file to discover all available pages before exploring further.
# Creating & Editing a Comparative Market Analysis (CMA)
**Why am I seeing “Subscribe to View” on the sold farms data?**
* If you do not have a paid subscription to CamoAg or Land Sales Bulletin you will not be able to view the transaction details for a sold property.
* If you have paid for a subscription please contact [support@camo.ag](mailto:support@camo.ag) for resolution
**What are "Sourced Auctions"?**
* Auctions added to the platform by the CamoAg team
**How can I tell what data source the comparable sales are coming from?**
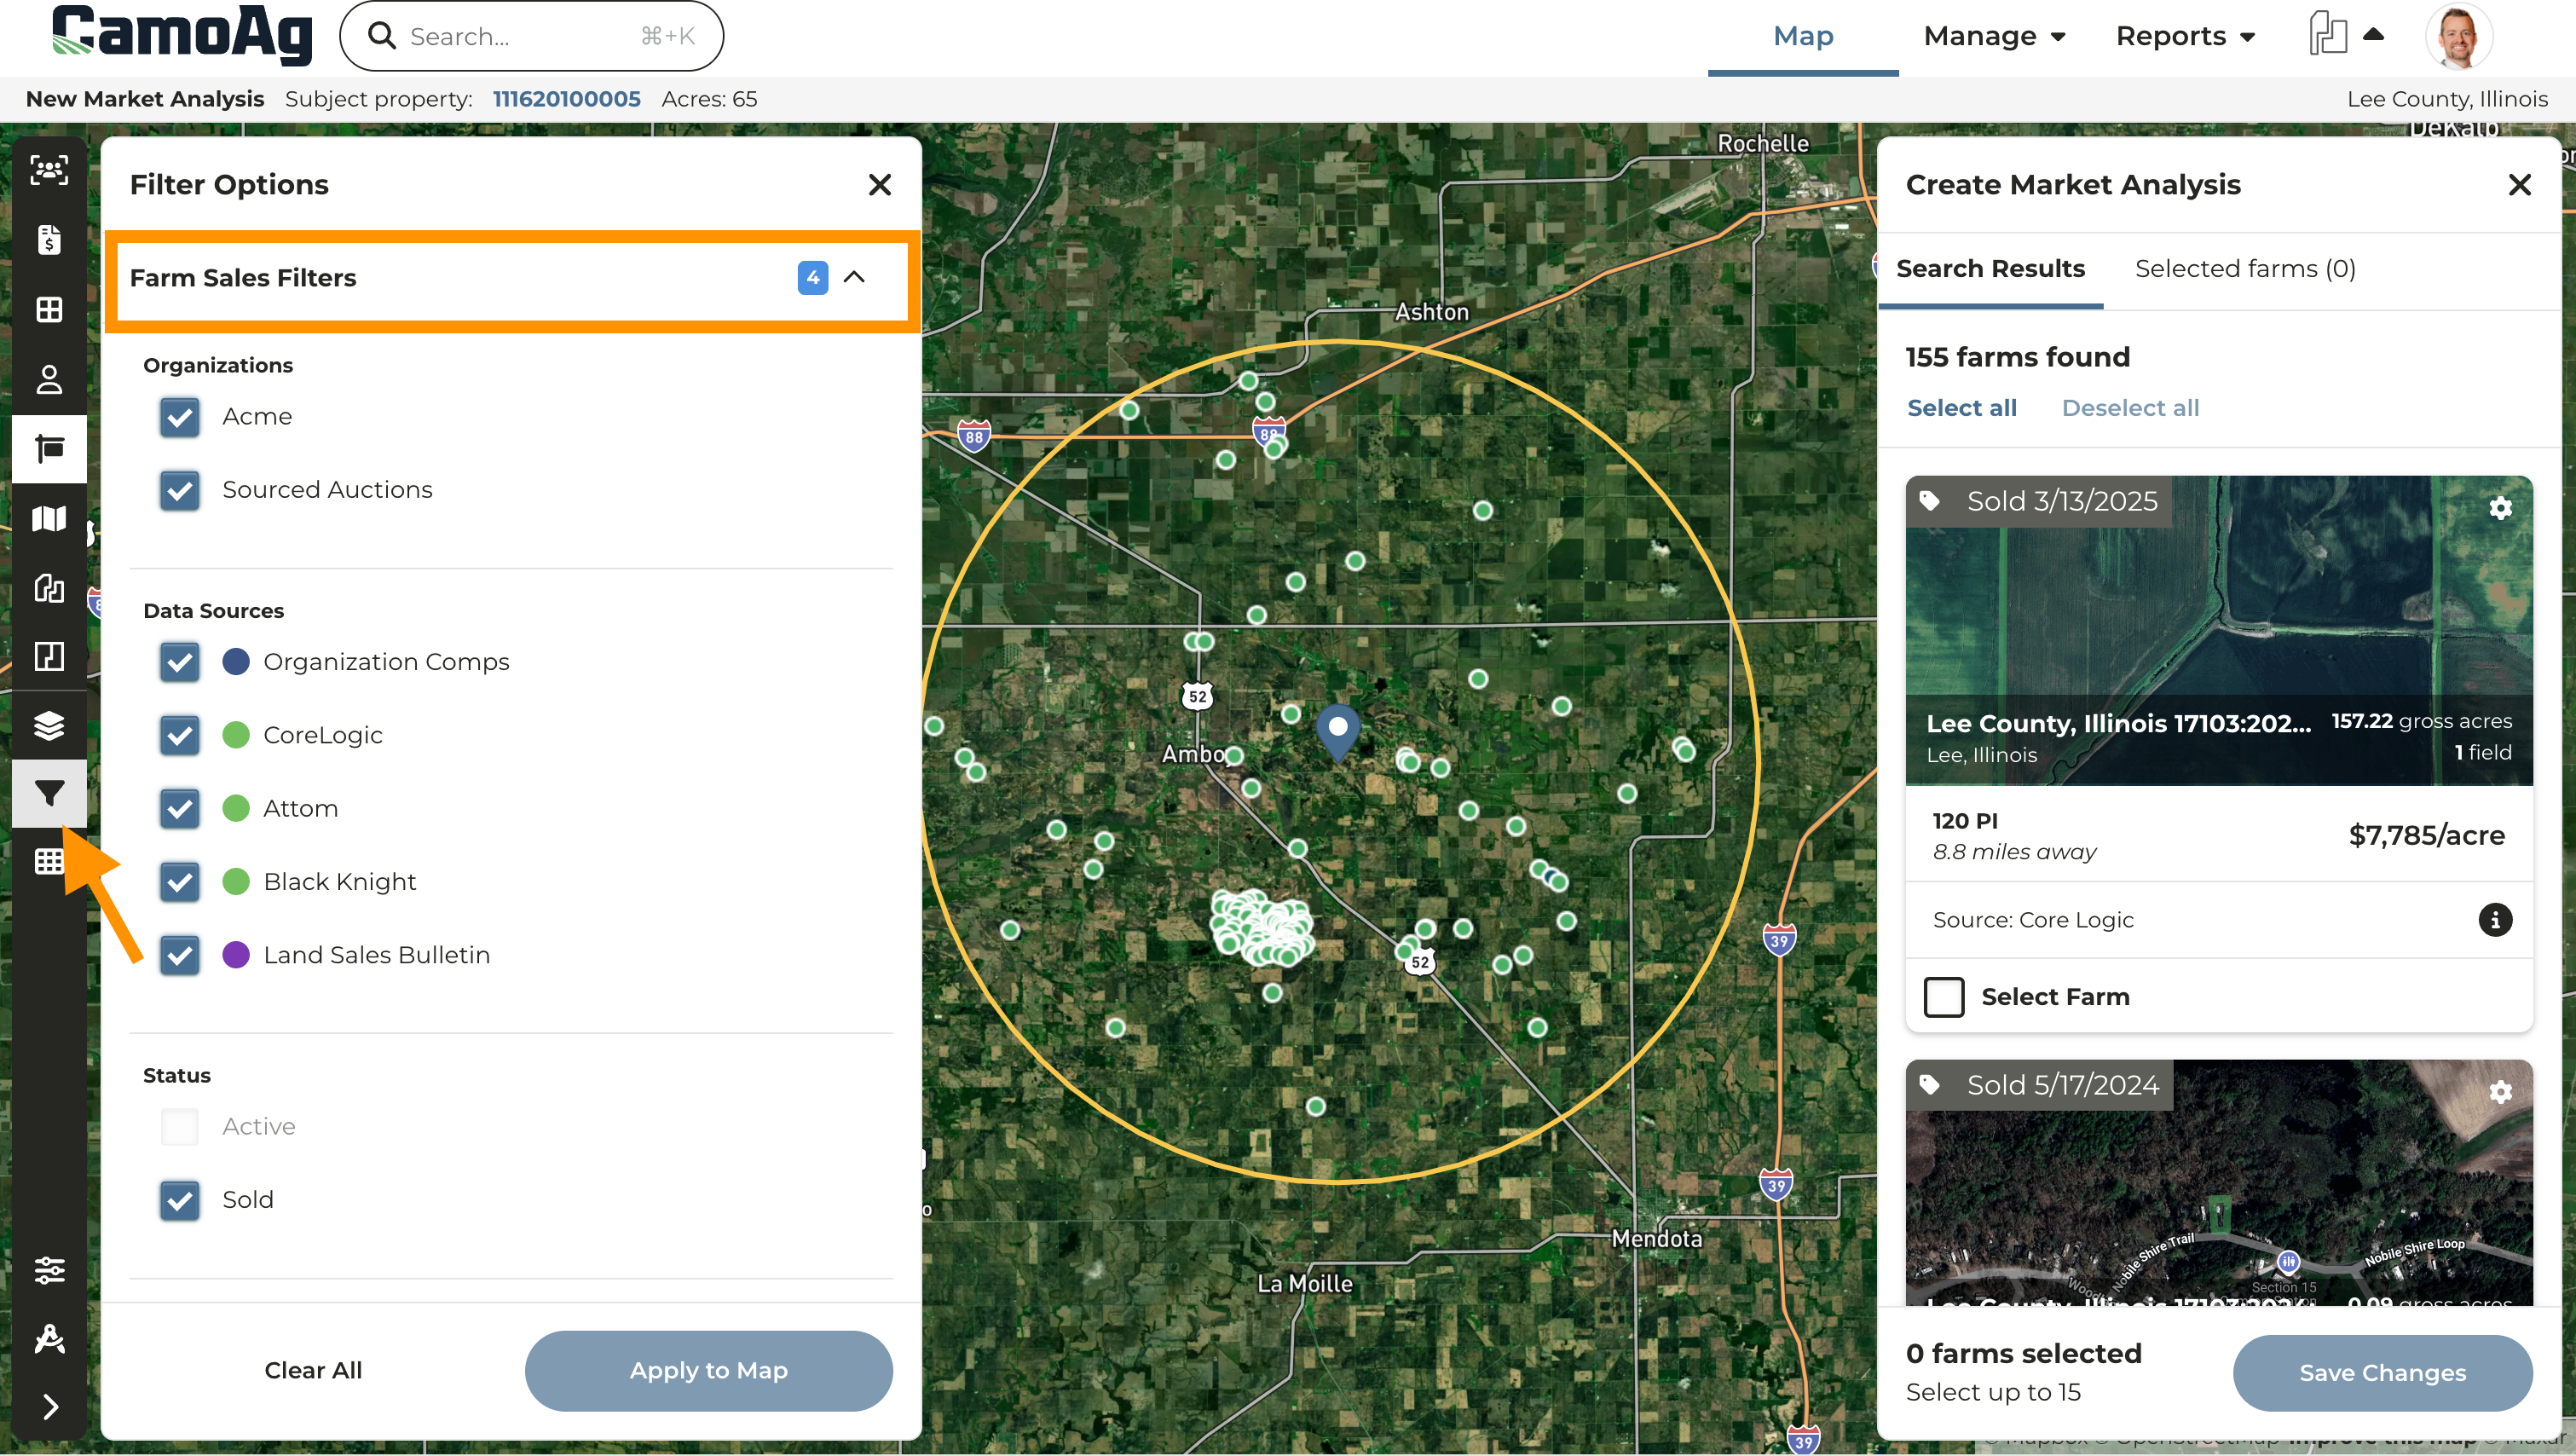
* **Green Flag** - Denotes sales comps pulled from CoreLogic, Attom, and Black Knight
* **Blue Flag** - Denotes private comps created by your organization
* **Purple Flag** - Denotes data from Land Sales Bulletin
**Is there a report where I can see all the CMAs that have been created by myself or my organization?**
* Yes - the [CMAs Created](/hc/en-us/articles/25954581460247-CMAs-Created-Report)
### **Creating a CMA**
* If you have previously added the subject property to your account, locate the property in CamoAg, click **Create CMA** and skip down to Step 5
* If you have not located the subject property, begin at Step 1.
1. From the dashboard click **Create CMA** and continue
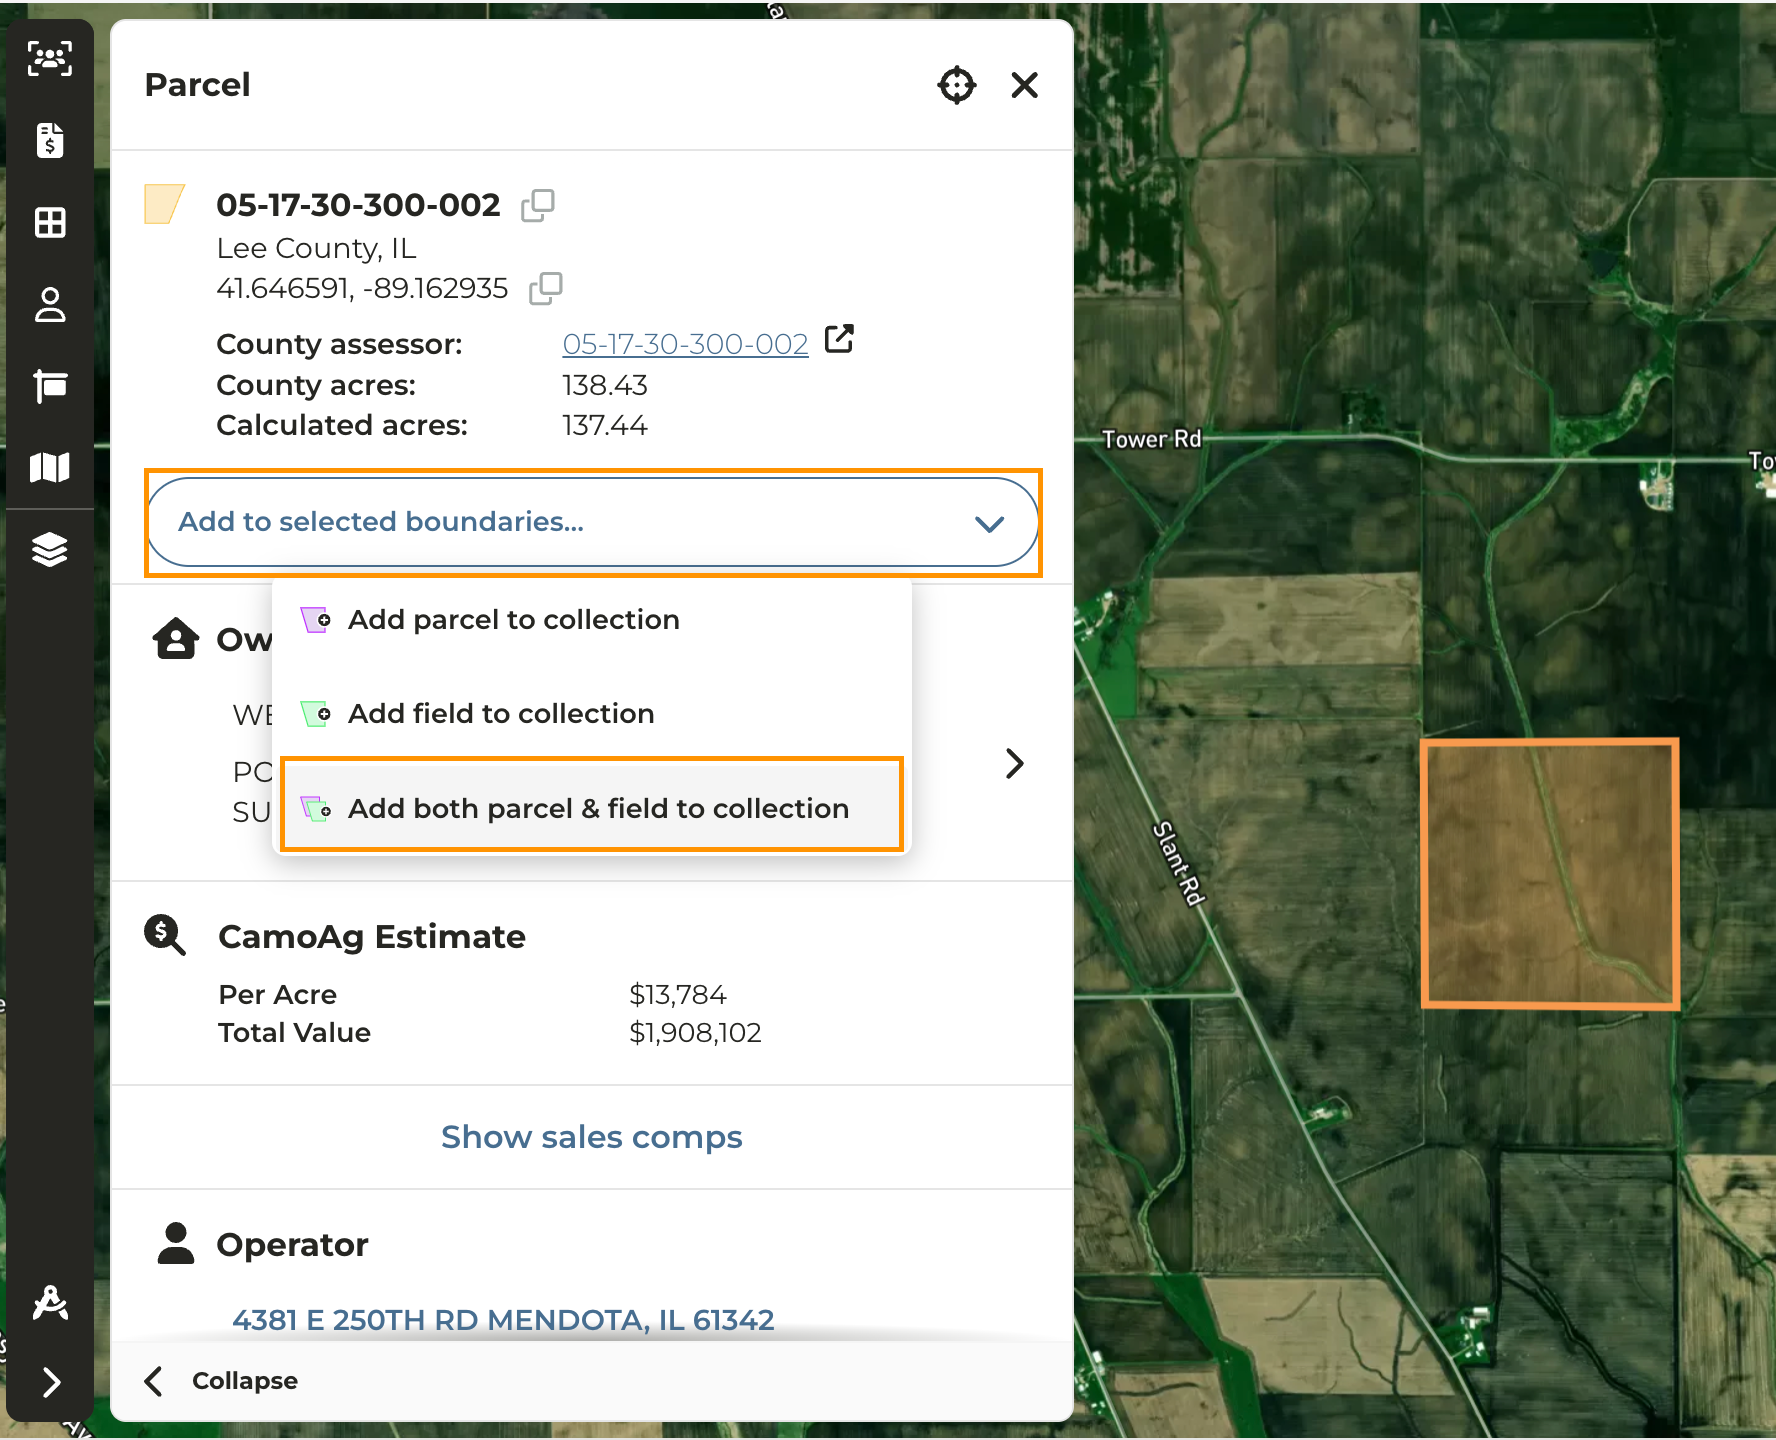
2. Locate the subject property on the map, **Add to selected boundaries > Add both Parcel & field to collection**
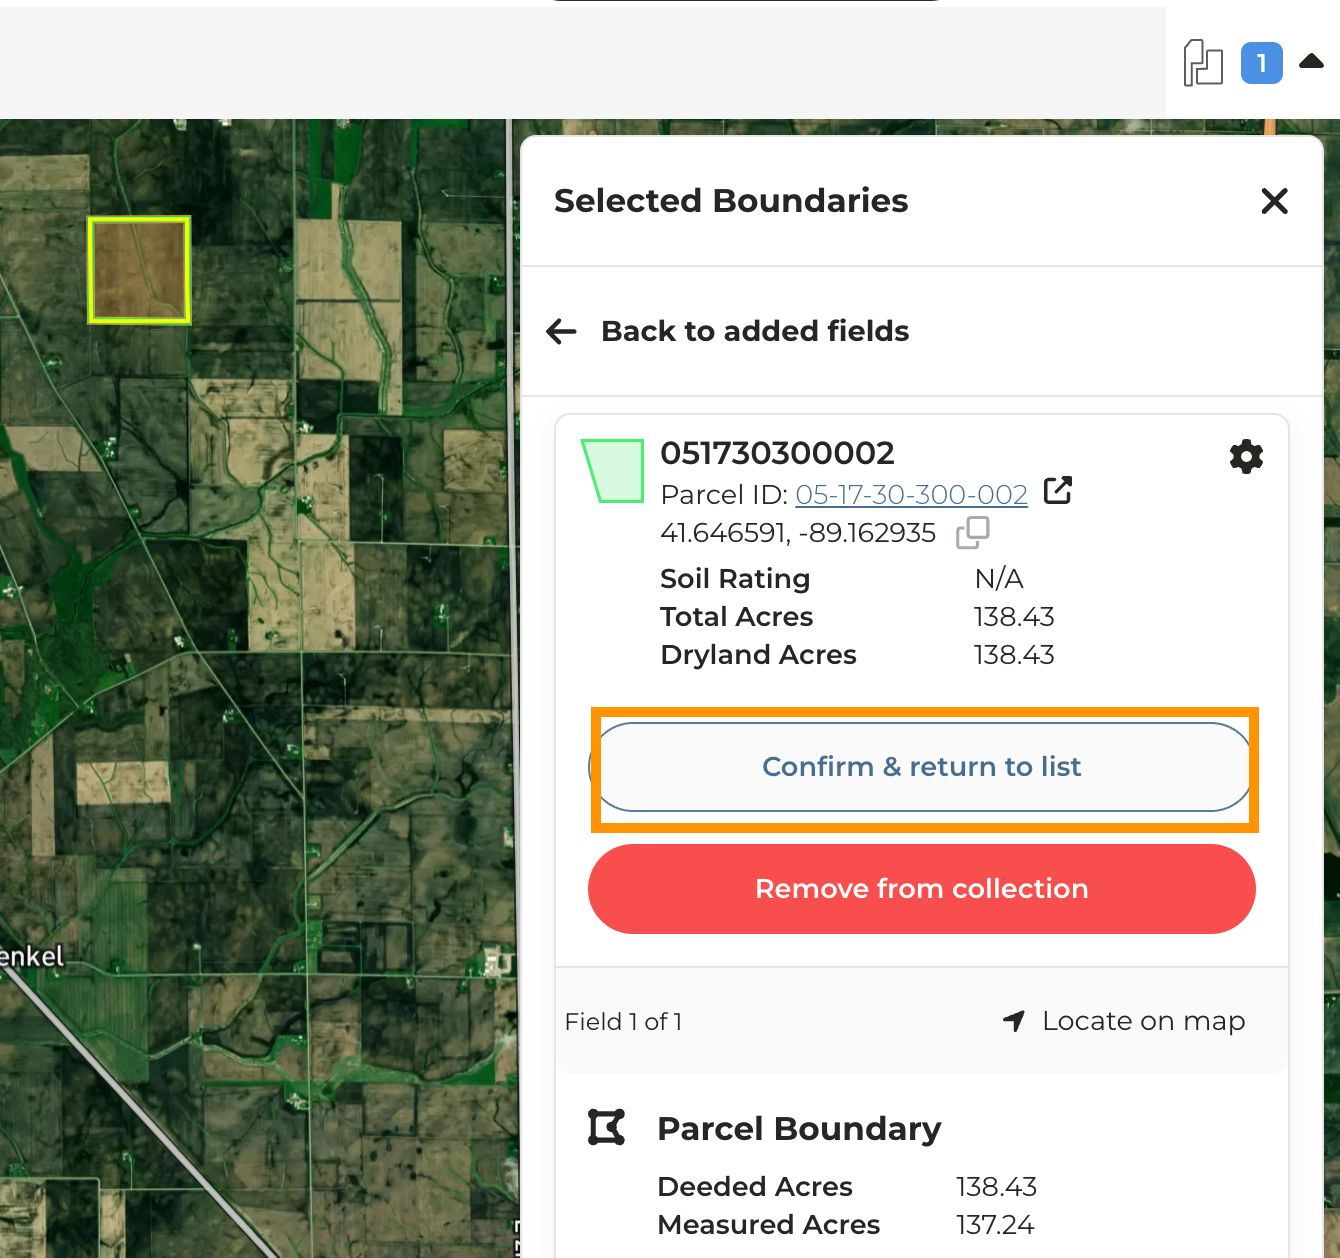
3. In the upper right corner expand the **Parcel Cart** then **Confirm & return to list**
4. Click **Add this farmland to my account**
5. On the map you will see the subject property marked in the center of the radius, with comparable sales within a ten (10) mile radius around it
6. To adjust the radius or apply additional filters click **Filter Options > Farm Sales Filters.** Note the farm sales filter panel is scrollable and allows you to filter sales by data sources, increase/decrease the radius of search, price per acre, soil rating, and more.
7. Zooming in on the map will reveal the sales flags which can be clicked on
8. Clicking on a comparable sale will reveal a panel on the left side providing additional details about the property and the sale
9. Comparable can be added to your analysis by either clicking **Add to** \*\* Market Analysis\*\* or checking \*\* Select Farm\*\*under the thumbnails on the right
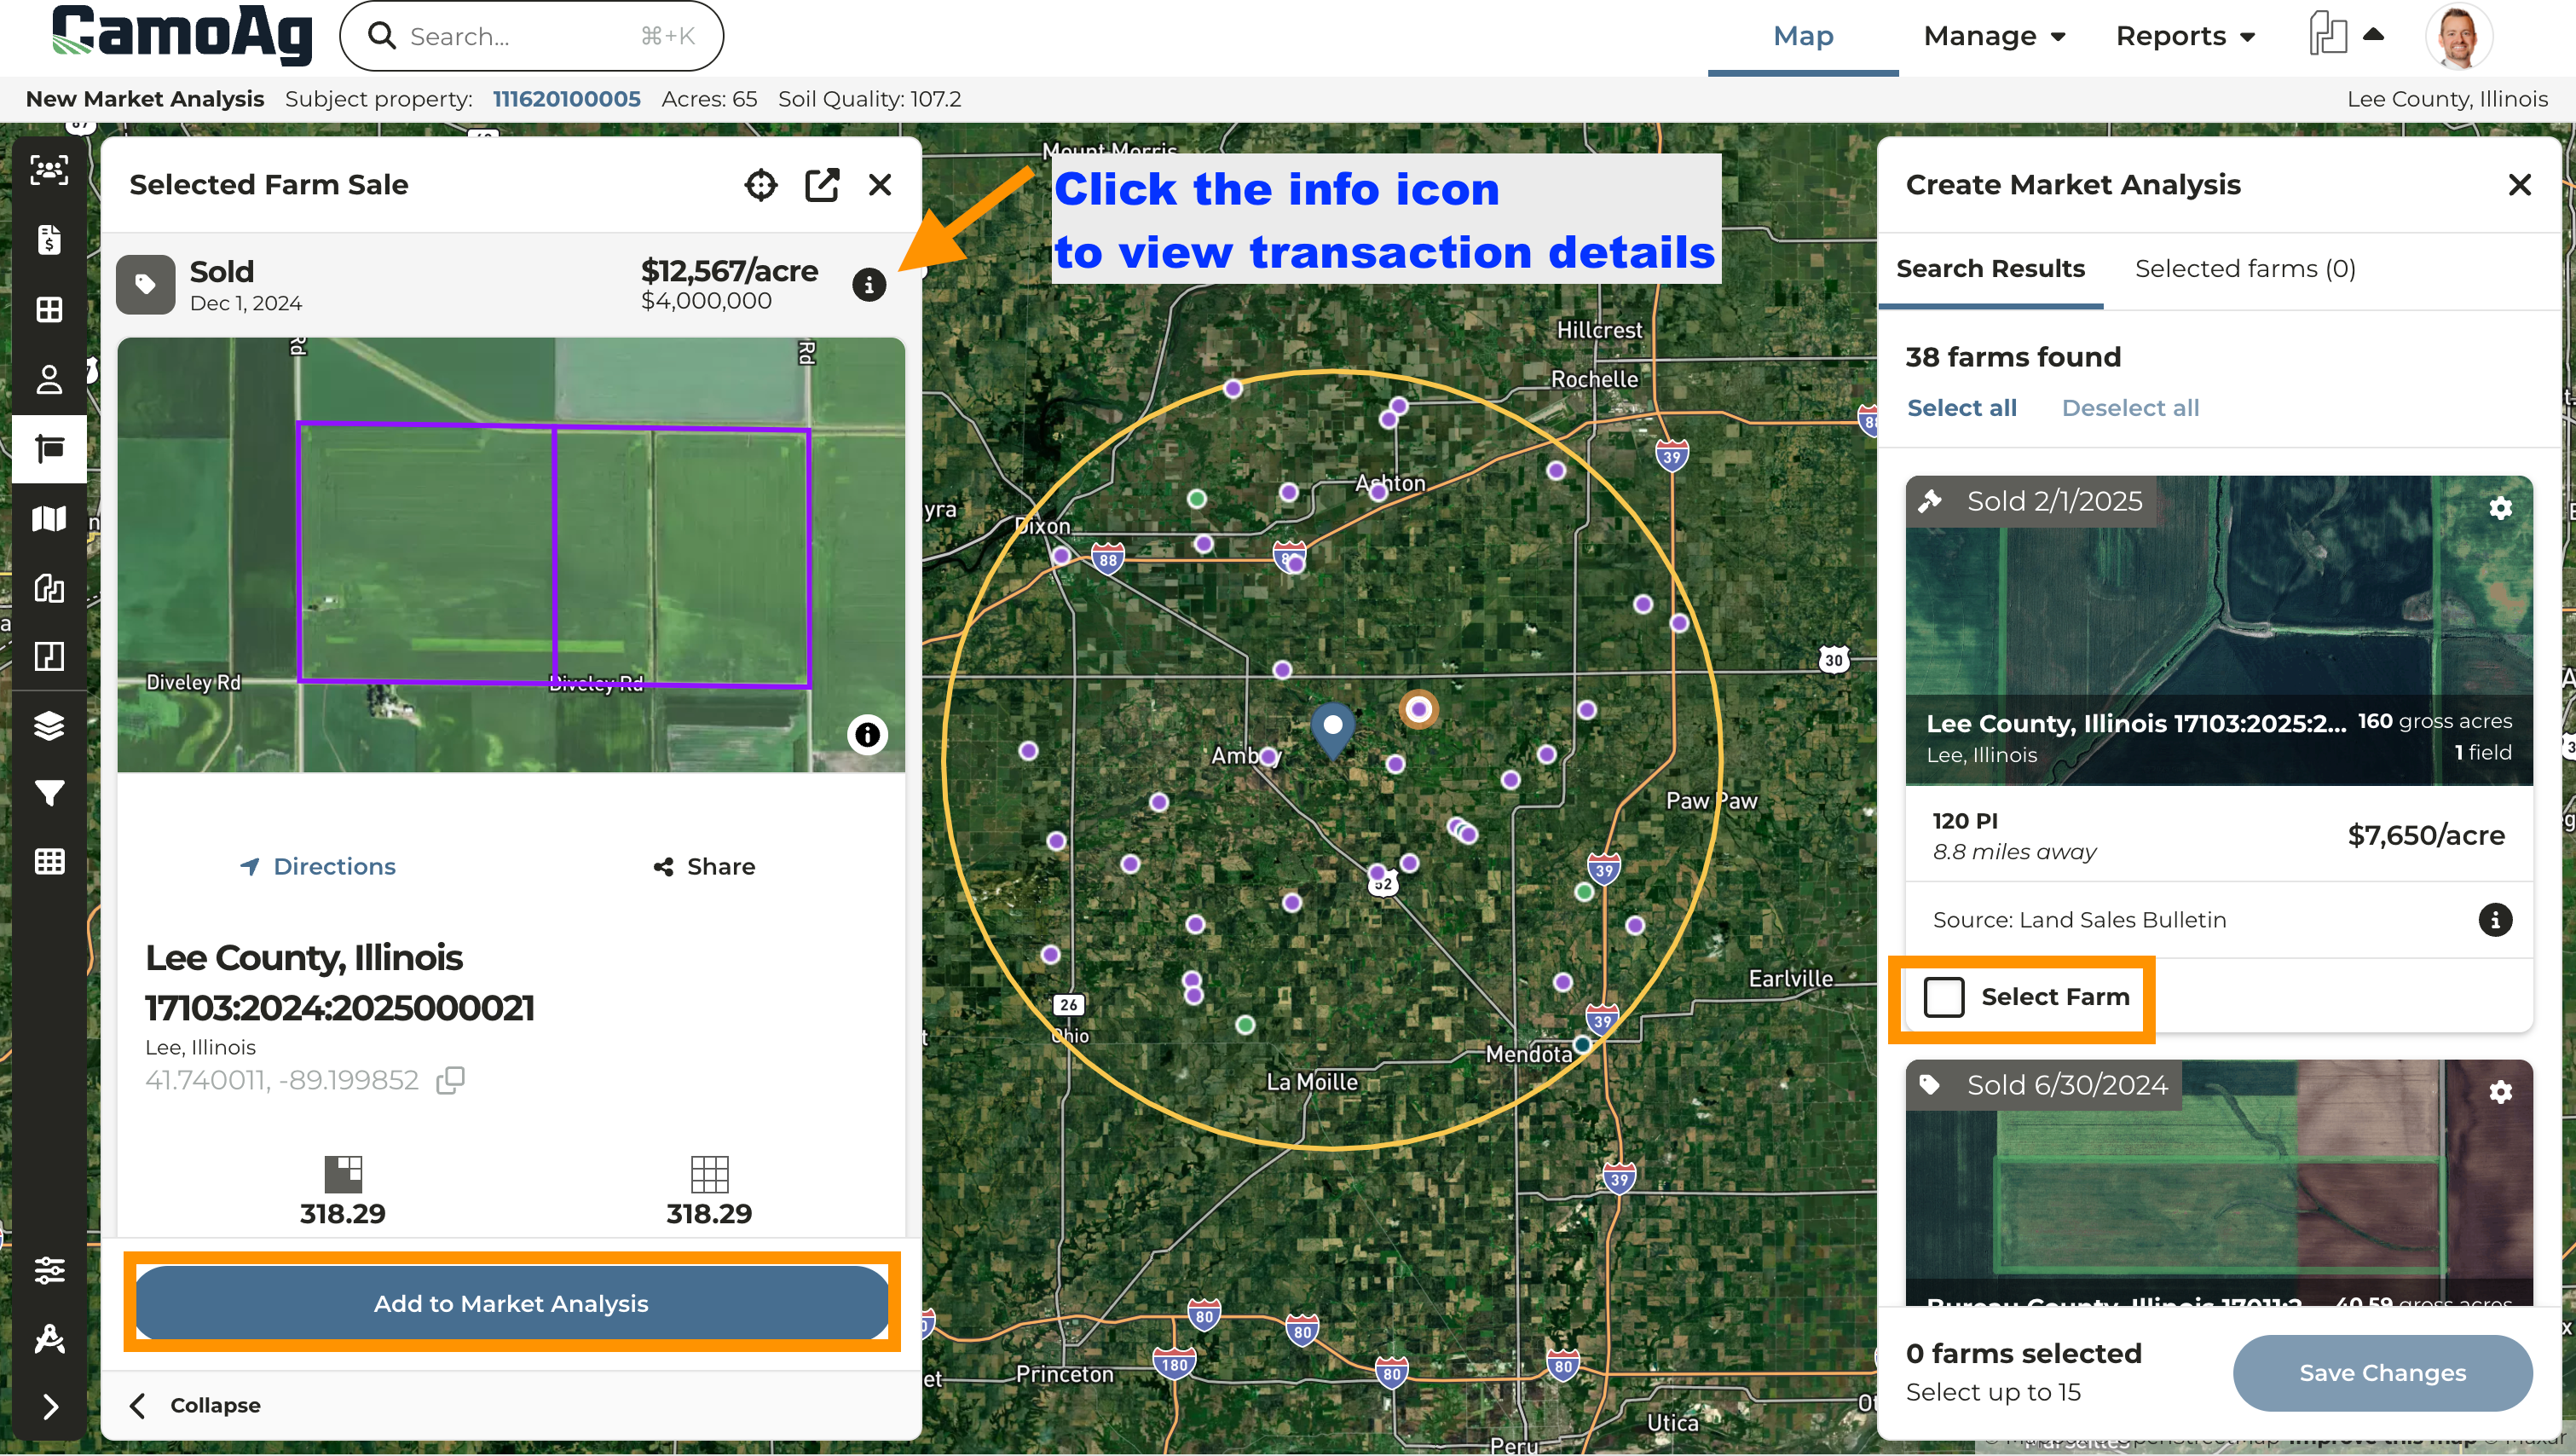
10. Once you've made your selections click **Save Changes > View Analysis**
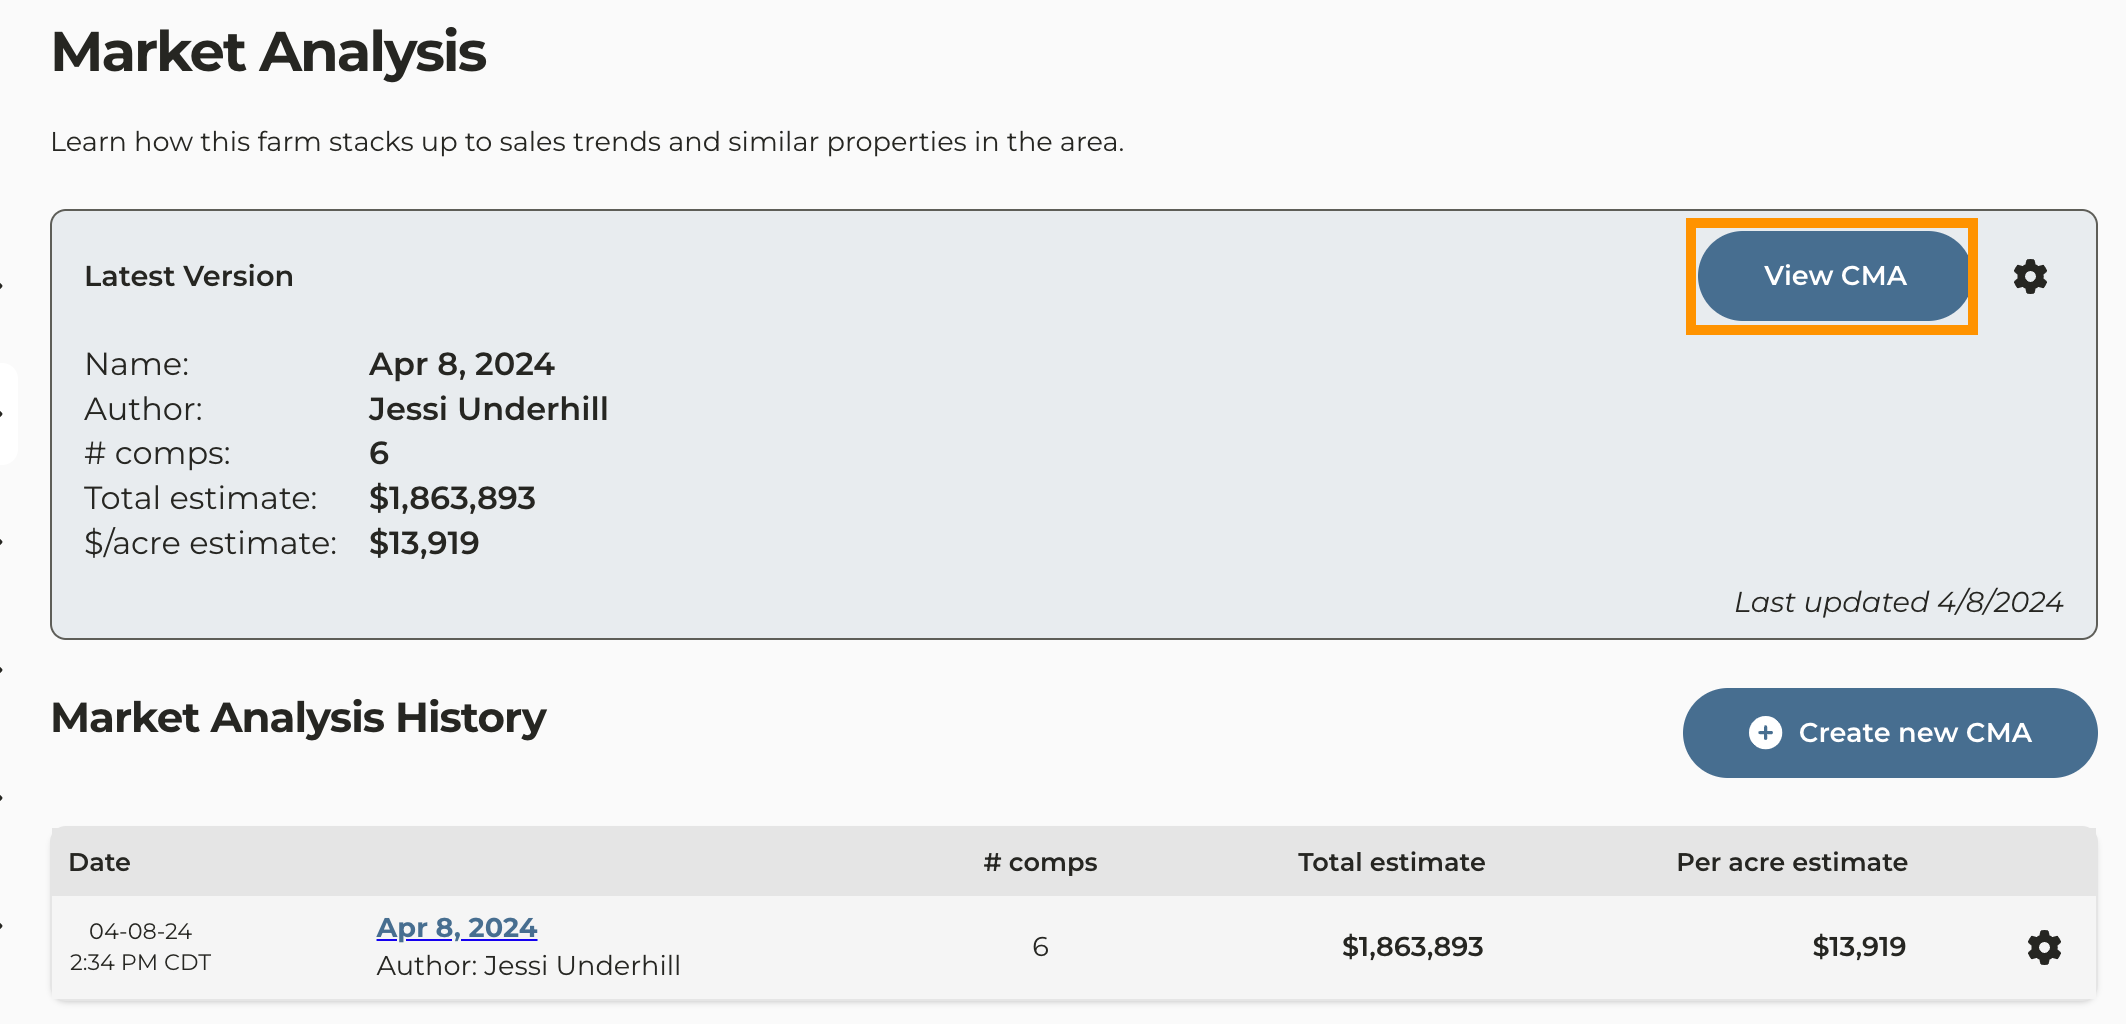
11. You will now be taken to the Market Analysis page, click **View CMA** to review and make edits
12. If different acre types have been designated to the subject property, you have the option of assigning a different value to each acre type by clicking the edit icon next to each acre type
* If you do not assign a value to the acre types, the data on the CMAs report will pull from the **Selected Comps Market Analysis**
* If a value has been assigned to the different acre types, the numbers you see in the **Acreage Type Market Analysis**, will populate the Market Analysis Average Price Per Acre and Market Analysis Average Total Estimated Value columns in the [CMAs Created report.](/hc/en-us/articles/25954581460247-CMAs-Created-Report)
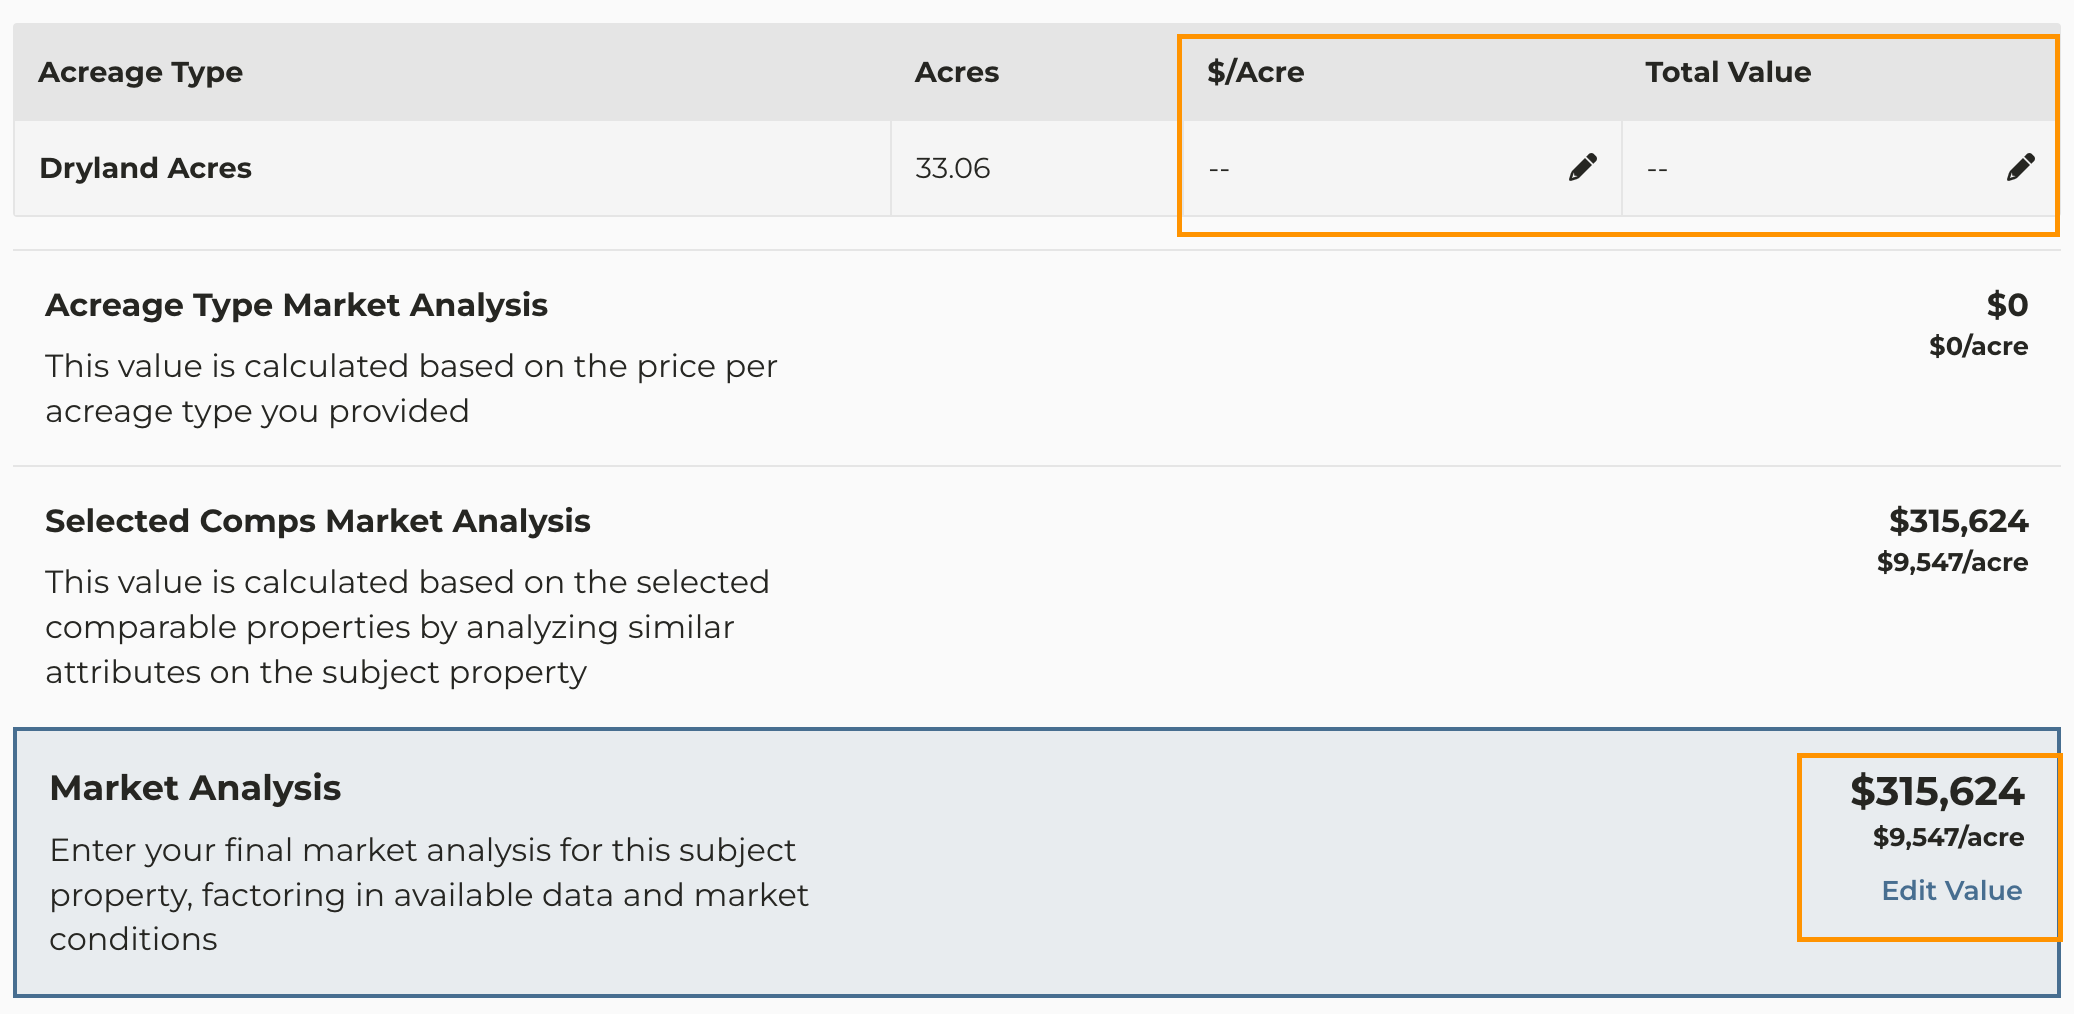
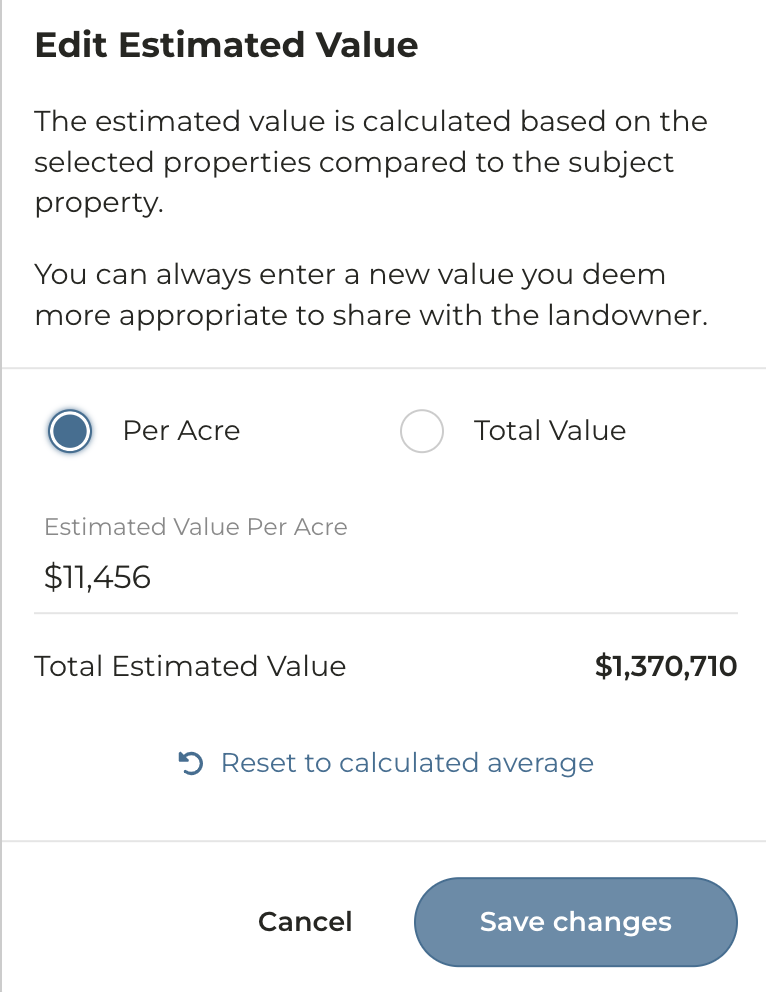
* To update the **Market Analysis** value to reflect your opinion, click **Edit Value,** update the value and click \*\*Save changes.\*\**Note: In order for the CMAs Created Report to populate with the this value, you must click \*\* Edit Value >\*\* \*\* Save changes,\*\*even if no edit is made to the value.*
* If using the **CMAs Created Report**, you will need to click \*\* Edit Value >\*\* \*\* Save changes\*\*even if no edits are made to the Total Estimated Value
13. If you want to update your selection of comparable farms you can do so by clicking on**Update Farms**
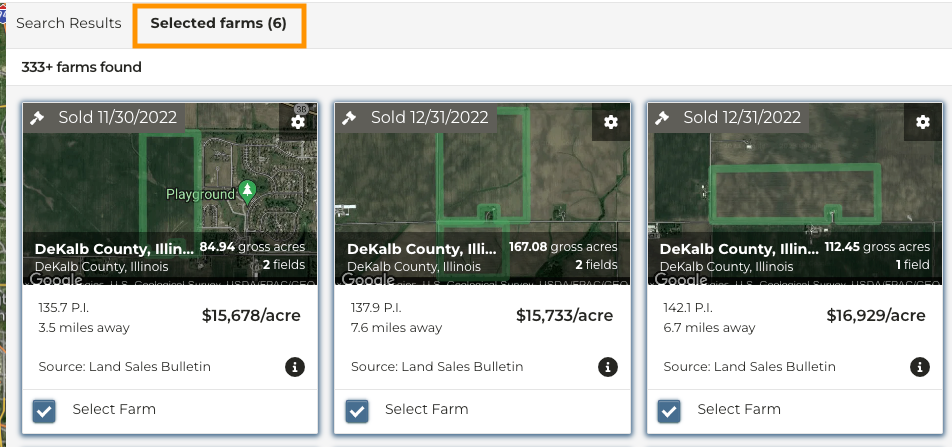
14. **To add more farms** to the analysis, select the farms you want to add from the map or the Search Results tab
15. **To remove a farm** from the analysis click on the \*\* Selected farms\*\*tab above the thumbnails and uncheck the box next to the property you wish to remove from the analysis.
16. Click **Save Changes**